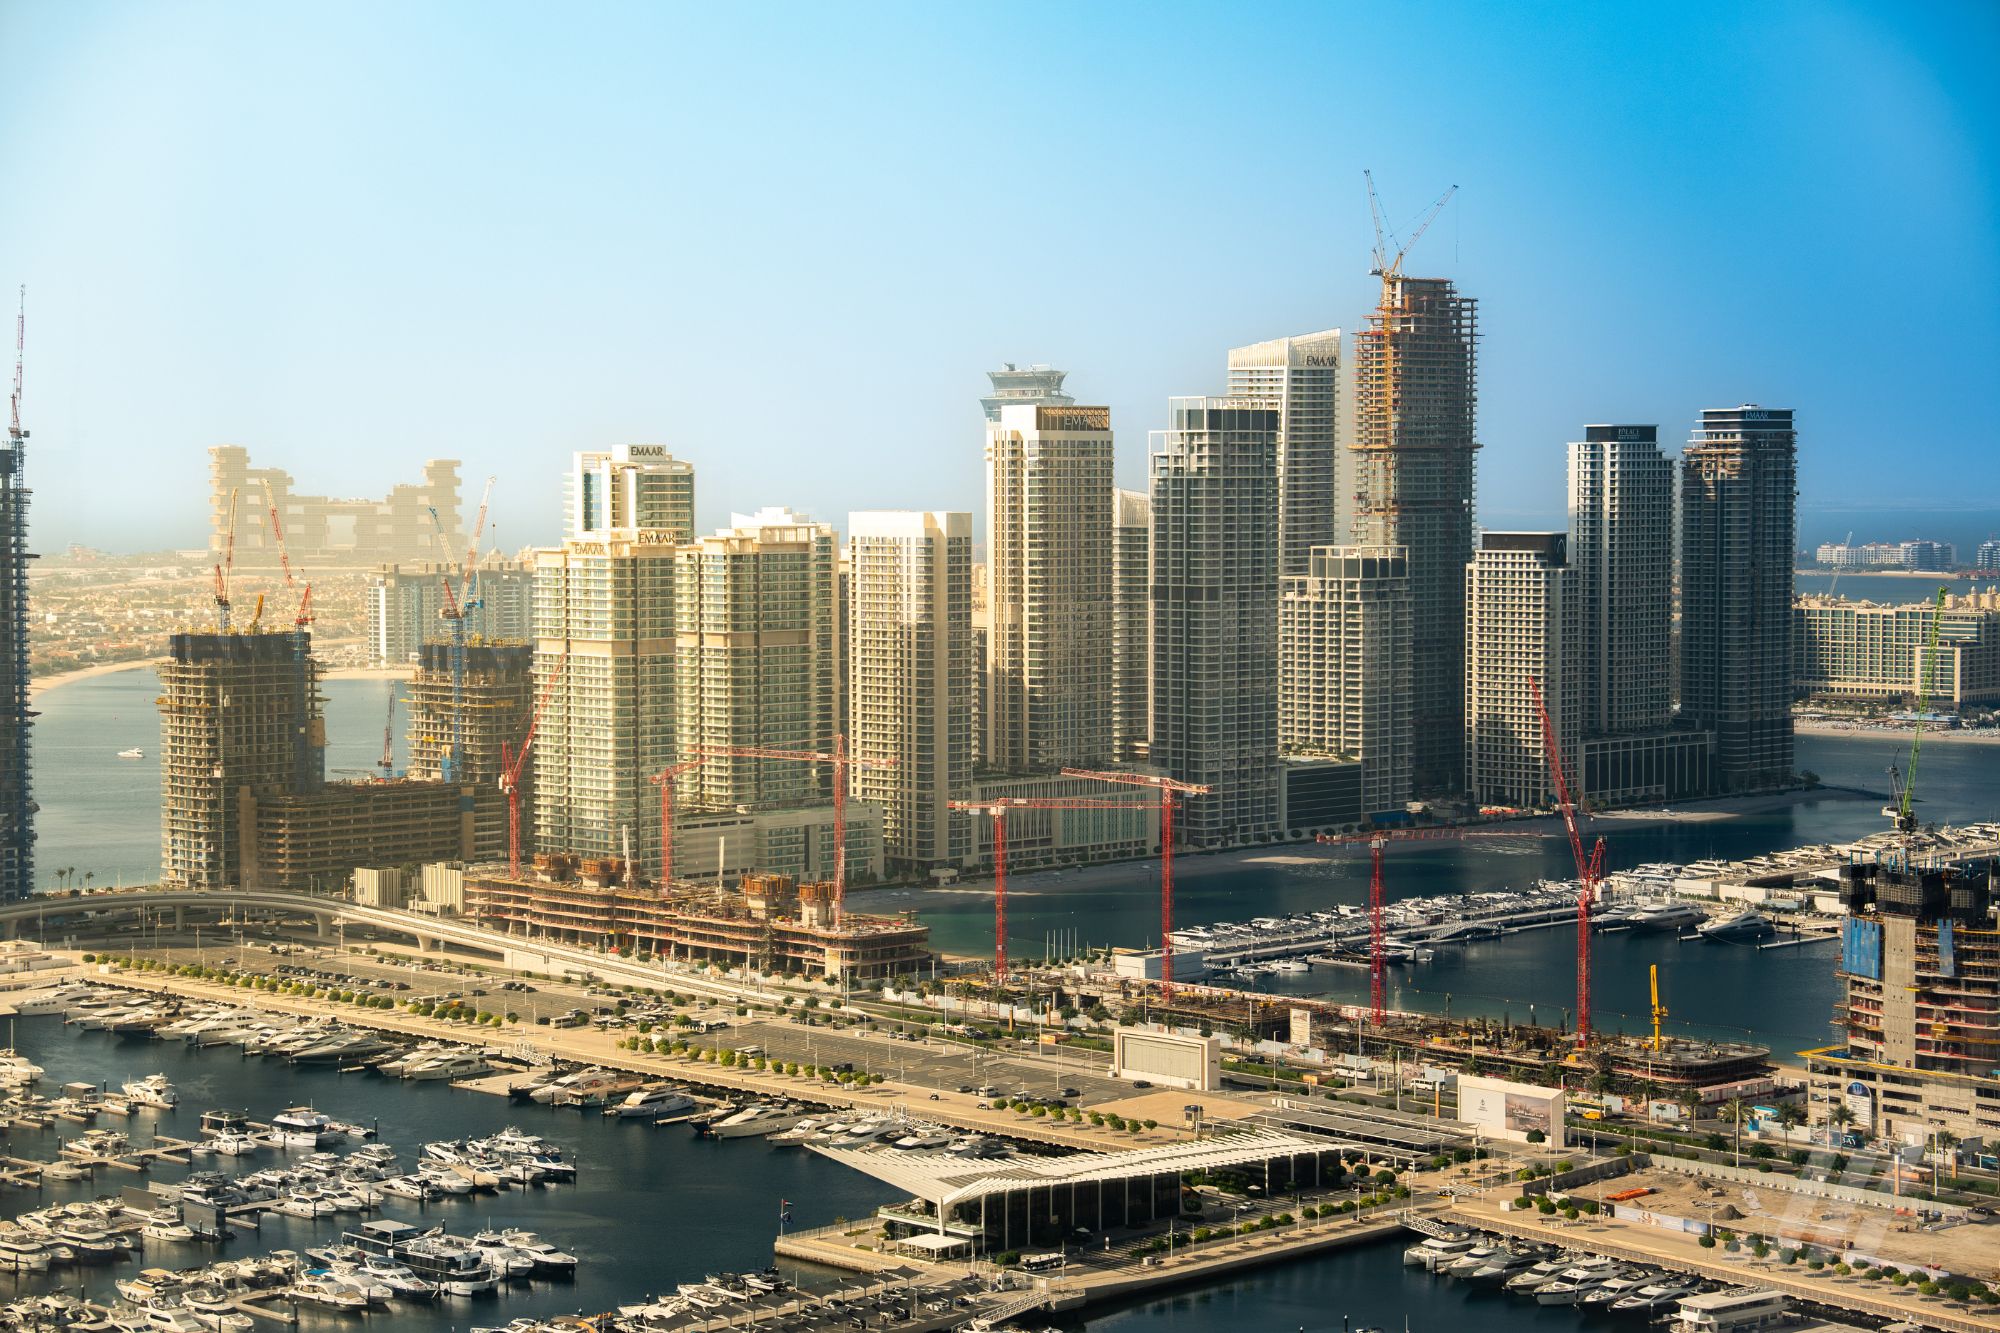
Aerial view of Dubai skyline at dusk
Worldfield Research · August 2026

Dubai Real Estate Market Report August 2026

A monthly intelligence brief on Dubai's residential and commercial markets — sales, rentals, off-plan activity and community-level price movements, reconciled from Dubai Land Department, Bayut and Property Monitor data.

May 2026 Report→June 2026 Report→July 2026 Report→August 2026 Report→
Speak to an Expert
0
Residential Sales Volume
Total transfers, August 2026
0
Total Rented Transactions
Tenancy contracts, August 2026
0
Sale / Resale Volume
Ready-property sales
0
Commercial Transactions
Commercial transactions, August 2026
0
Off-Plan Sales Volume
Residential Oqood registrations
AED 0.00M
Avg Residential Sale Price
Per transaction
AED 0
Avg Residential Rental
Yearly contract value
Executive Summary

Off-plan remains the larger sales segment as August sales volumes ease.

Dubai recorded 11,192 residential sales in August 2026 in the supplied Bayut data, comprising 8,086 off-plan sales and 3,106 ready-property sales. Off-plan accounted for 72.2% of this total. The August data reports a 15.1% month-on-month decline in off-plan sales and a 12.7% decline in ready-property sales.

Residential rental contracts totalled 51,882, with an average rental price of AED 94,474. Commercial sales comprised 235 ready-property transactions and 238 off-plan transactions. Commercial rental contracts totalled 27,107.

Community prices moved in different directions. The Hills (+3.56%) led the apartment sales-price chart, while Motor City (+6.31%) led villa and townhouse sales-price gains. Al Jaddaf (-6.91%) and Sobha Hartland (-12.64%) showed the largest visible sales-price declines in their respective charts. For rentals, Dubai Festival City (+2.12%) led apartments and Living Legends (+6.93%) led villas and townhouses.

Key Insights
  • Residential sales: 11,192
  • Residential rental contracts: 51,882
  • Off-plan residential sales: 8,086, or 72.2% of the residential sales total
  • Ready residential sales: 3,106, or 27.8%
  • Ready commercial sales: 235; off-plan commercial sales: 238
  • Largest visible apartment sales-price gain: The Hills, +3.56%
  • Largest visible villa/townhouse sales-price gain: Motor City, +6.31%
  • Largest visible apartment rental-price gain: Dubai Festival City, +2.12%
  • Largest visible villa/townhouse rental-price gain: Living Legends, +6.93%
  • Largest visible apartment sales-price decline: Al Jaddaf, −6.91%
  • Largest visible villa/townhouse sales-price decline: Sobha Hartland, −12.64%
Performance Summary

Transaction performance — August 2026.

August volumes eased from July, with off-plan activity retaining the lead while ready residential sales and rents remained substantial across Dubai.

Rent

Commercial Properties

Rentals Volume
27,107
Average Yearly Rental
AED 67,919-7.7%
Avg Yearly Rental / sqft
AED 137-9.4%
Rent

Residential Properties

Rentals Volume
51,882
Average Yearly Rental
AED 94,474+4.5%
Avg Yearly Rental / sqft
AED 84+3.2%
Ready Sales

Commercial Properties

Sales Volume
235-18.1%
Average Price
AED 12.298M-4.2%
Avg Price / sqft
AED 1,861-7.4%
Ready Sales

Residential Properties

Sales Volume
3,106-12.7%
Average Price
AED 2.840M-19.2%
Avg Price / sqft
AED 1,617-0.2%
Off-Plan

Commercial Properties

Sales Volume
238-29.4%
Average Price
AED 4.470M+15.5%
Avg Price / sqft
AED 2,944-0.8%
Off-Plan

Residential Properties

Sales Volume
8,086-15.1%
Average Price
AED 1.895M+6.0%
Avg Price / sqft
AED 1,874+0.3%
Source: Dubai Land Department, Bayut, Property Monitor, Worldfield Research.
Residential Sales Trend

Month-on-month residential sales price movements.

Top 5 performing and under performing communities by price change between July and August 2026, segmented by asset type.

Apartment Sales Price — July to August

Top 5 Performing
  • The Hills+3.56%
  • Meydan+2.77%
  • Al Barari+2.35%
  • Al Barsha+2.20%
  • Dubai Studio City+2.17%
Top 5 Under Performing
  • Al Jaddaf-6.91%
  • Dubai Investments Park-3.97%

Villa / Townhouse Sales Price — July to August

Top 5 Performing
  • Motor City+6.31%
  • Jumeirah Golf Estates+5.11%
  • Jumeirah Bay Island+4.60%
  • Palm Jumeirah Fronds – Garden Homes+4.34%
  • Jumeirah Village Triangle Villas+3.70%
Top 5 Under Performing
  • Sobha Hartland-12.64%
  • Jumeirah Islands-10.22%
Source: Dubai Land Department, Bayut, Property Monitor, Worldfield Research.
Rental Price Trend

Month-on-month rental price movements.

Top 5 performing and under performing communities by rental change between July and August 2026.

Apartment Rental Price — July to August

Top 5 Performing
  • Dubai Festival City+2.12%
  • Jaddaf Waterfront+1.50%
  • Majan+1.46%
  • Dubai Residence Complex+0.77%
  • Barsha Heights+0.61%
Top 5 Under Performing
  • Dubai Islands-5.64%
  • Mohammed Bin Rashid City-5.01%
  • Mirdif-3.01%

Villa / Townhouse Rental Price — July to August

Top 5 Performing
  • Living Legends+6.93%
  • Emirates Hills+6.36%
  • Jumeirah Golf Estates+2.27%
  • Victory Heights+1.30%
  • The Lakes+0.94%
Top 5 Under Performing
  • Jumeirah Bay Island-4.65%
  • Palm Jumeirah Fronds – Garden Homes-3.12%
  • Arabian Ranches 3-2.74%
  • DAMAC Lagoons-2.35%
  • Dubai Hills Estate-1.91%
Source: Dubai Land Department, Bayut, Property Monitor, Worldfield Research.
Sales Mix

Off-plan accounted for more than seven in ten residential sales.

Of 11,192 residential sales in the supplied Bayut data for August 2026, 8,086 were off-plan (72.2%) and 3,106 were ready properties (27.8%).

11,192 · August 2026
11,192
August 2026
  • Off-plan 72.2%72.2%
  • Ready property 27.8%27.8%
What This Means For You

Tailored implications for every market participant.

Investors

Off-plan accounted for 72.2% of the residential sales counted in the August data, underlining the continued appeal of launch inventory.

Discuss with our team

End-Users

There were 3,106 ready-property sales during August, offering a sizable stock of immediate-possession options for owner-occupiers.

Discuss with our team

Landlords

Residential rental contracts totalled 51,882; compare rents within the relevant community and property type before setting a new asking price.

Discuss with our team

Developers

There were 8,086 off-plan residential sales and 238 off-plan commercial sales, pointing to sustained launch demand across both sectors.

Discuss with our team
Lead Generation

Need expert Dubai real estate advice?

Our advisory team works with investors, end-users, landlords and developers across Dubai's residential and commercial markets. Request a confidential consultation.

Location

Worldfield Real Estate LLC
Onyx Tower 1, Office 814, Dubai,
P.O. Box 566069, U.A.E.

Contact

  • +971 (0)50 347 2079
  • +971 (0)4 398 0822
  • contact@worldfield.com

Properties

  • Residential Investments
  • Secondary Properties
  • Leasing

Quicklinks

  • Blogs
  • Terms & Conditions
  • Privacy Policy
  • Customer Complaints and Dispute Resolution Policy
© 2026 Worldfield Real Estate. All rights reserved.Source: Dubai Land Department, Bayut, Property Monitor, Worldfield Research.
Dubai commercial real estate skyline
Worldfield Research

Dubai market intelligence, reserved for informed decisions.

Access detailed transaction performance, pricing movement and community-level trends from Worldfield Research.

Complimentary Access

Unlock the full market report.

Enter your details to view Worldfield's latest Dubai real estate market analysis.

Q22026

Your information will only be used for relevant property and market-related communication.