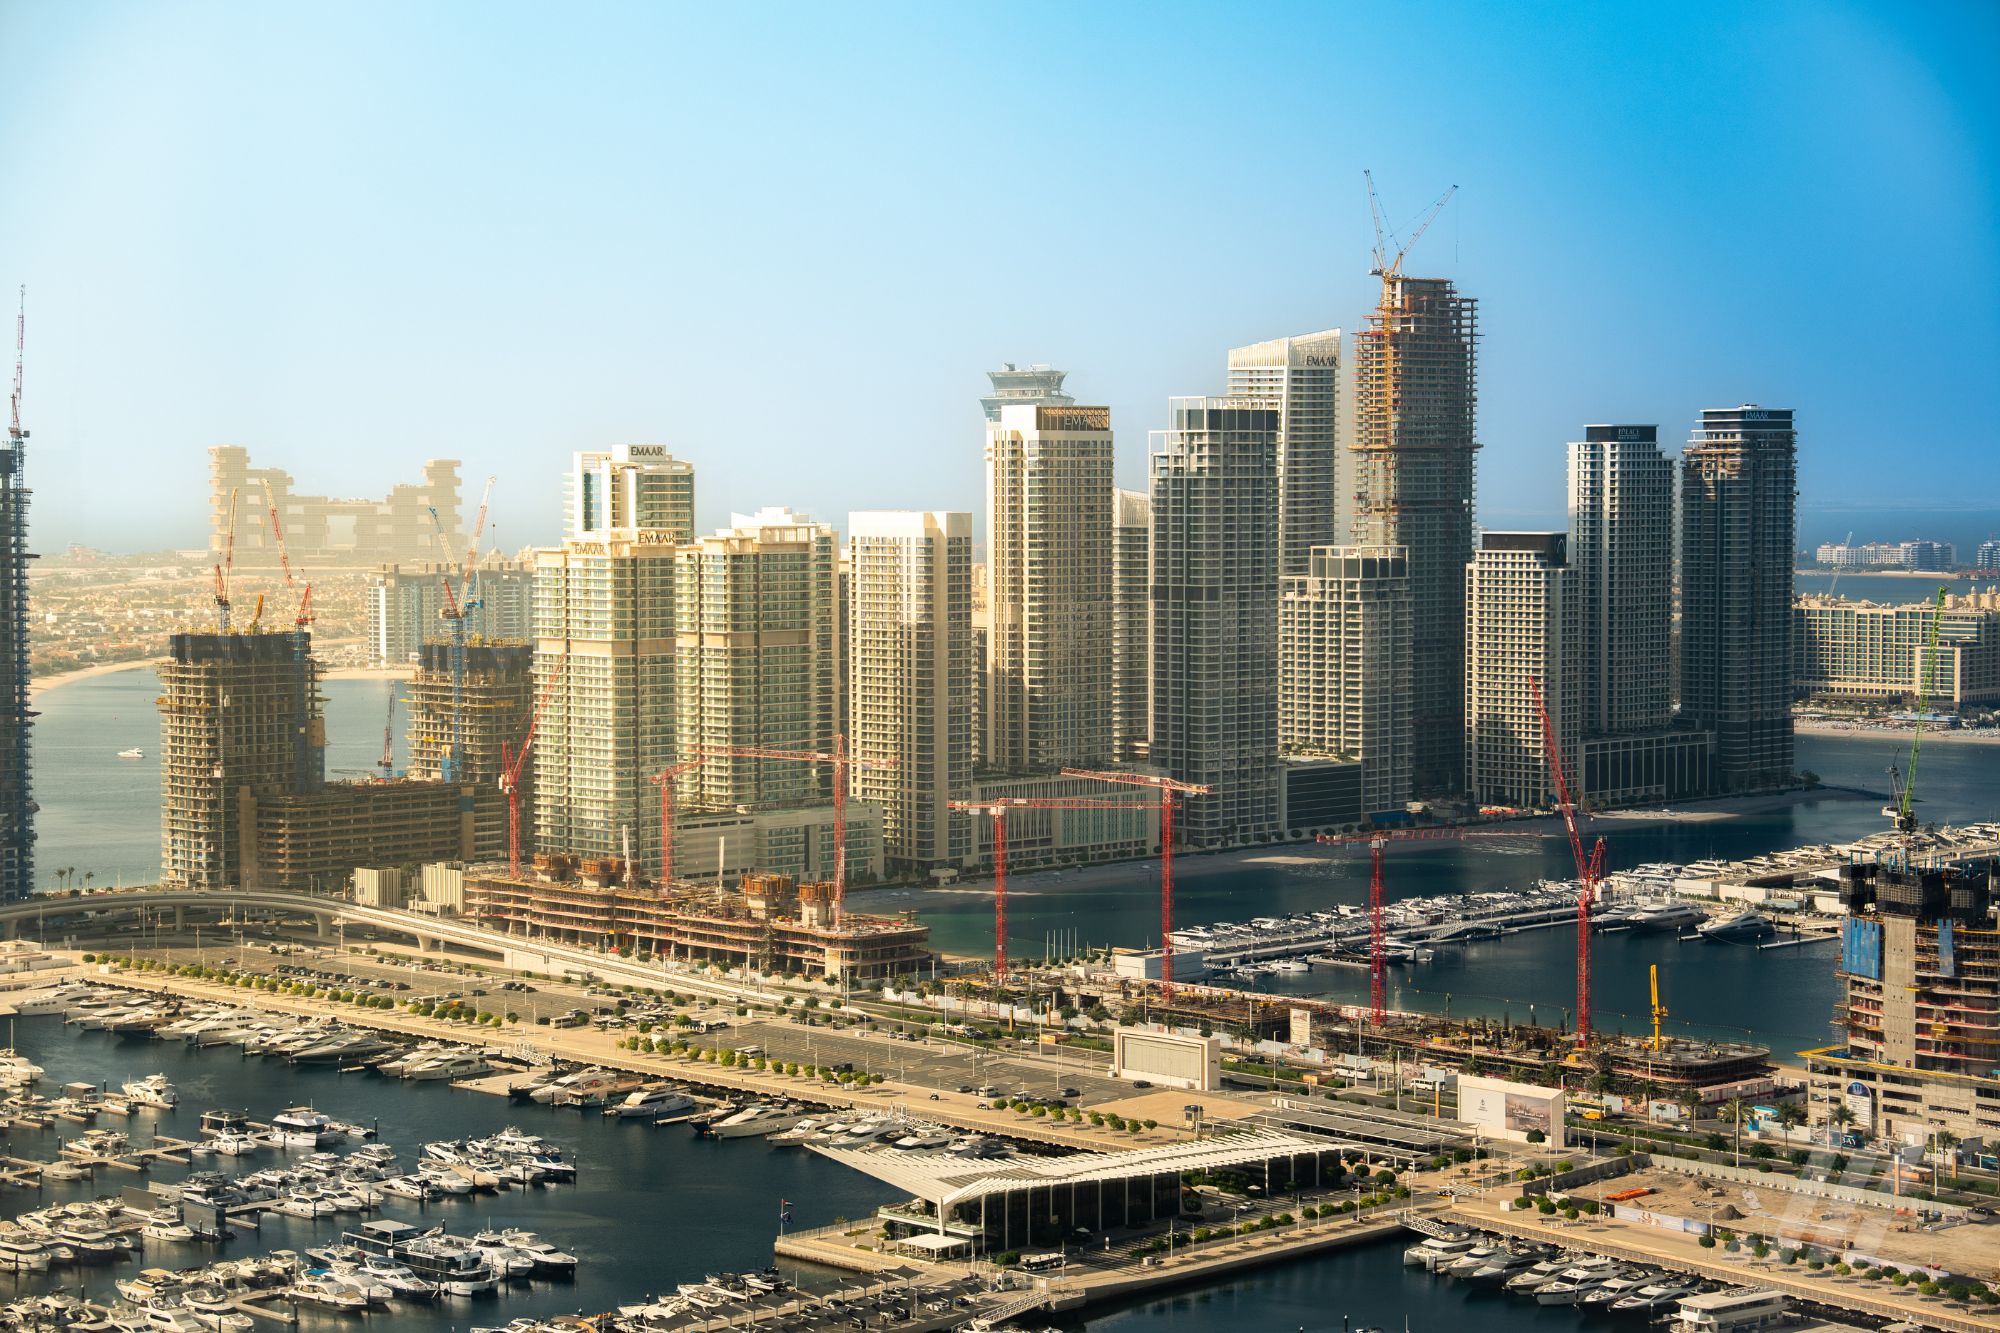
Aerial view of Dubai skyline at dusk
Worldfield Research · September 2026

Dubai Real Estate Market Report — September 2026

Residential and commercial sales and rental activity, with selected community price movements from the supplied Bayut, Dubai Land Department and Property Monitor sources.

May 2026 Report→June 2026 Report→July 2026 Report→August 2026 Report→September 2026 Report→
Speak to an Expert
0
Residential Sales Volume
3,255 ready + 7,197 off-plan residential sales
0
Residential Rental Transactions
Supplied residential rental transactions
0
Ready Residential Sales
Ready-property sales; not all verified resales
0
Commercial Sales Transactions
313 ready + 326 off-plan; excludes rentals
0
Off-Plan Residential Sales
Supplied off-plan residential sales
AED 0.000M
Average Ready Residential Sale Price
Ready residential segment only
AED 0
Average Residential Rental Price
Rent period not stated in source
Executive Summary

Off-plan remains the larger residential sales segment, while ready-property and commercial sales rise against supplied August counts.

September transaction data records 10,452 residential sales: 7,197 off-plan and 3,255 ready-property transactions. Off-plan represented 68.9% of sales and ready property 31.1%. Compared with counts in the supplied August brief, total residential sales were 6.6% lower, ready sales 4.8% higher and off-plan sales 11.0% lower; these comparisons are calculated from supplied monthly figures.

Residential rental activity totalled 51,918 transactions, with an average reported rental price of AED 94,885; the source does not state the rent period. Commercial sales totalled 639, split between 313 ready-property and 326 off-plan transactions. Commercial rental activity totalled 27,538 transactions.

Community movements varied by location and property type. Jaddaf Waterfront (+3.22%) led the displayed apartment sales-price gains, while Jumeirah Village Triangle (+6.27%) led villa/townhouse gains. Al Jaddaf (−10.95%) and Motor City (−7.47%) showed the largest respective charted declines. Rental-price gains were led by Jumeirah Bay Islands (+6.71%) for apartments and Emirates Hills (+3.60%) for villas/townhouses; Dubai Islands (−4.39%) and The Lakes (−2.72%) showed the largest respective charted declines. These are selected community chart movements, not citywide trends.

Key Insights
  • Residential sales totalled 10,452: 68.9% off-plan and 31.1% ready property
  • Total residential sales were 6.6% lower than supplied August counts, calculated from supplied monthly figures
  • Ready residential sales were 4.8% higher and off-plan sales 11.0% lower than supplied August counts, calculated from supplied monthly figures
  • Residential rentals: 51,918 transactions; the source does not state the rent period
  • Commercial sales totalled 639: 313 ready and 326 off-plan transactions
  • Commercial rental activity totalled 27,538 transactions; no month-on-month direction is stated
  • Community chart leaders vary by segment and do not establish citywide trends
  • Jaddaf Waterfront led displayed apartment sales gains (+3.22%); Jumeirah Village Triangle led villa/townhouse gains (+6.27%)
Performance Summary

Transaction performance — September 2026.

September absolute transaction figures are shown from the supplied source. Reported month-on-month percentages are withheld pending reconciliation with the supplied August figures.

Ready Sales

Residential Properties

Sales Volume
3,255
Average Price
AED 2,954,000
Average Price / sq ft
AED 1,619
Off-Plan

Residential Properties

Sales Volume
7,197
Average Price
AED 1,980,000
Average Price / sq ft
AED 1,873
Rent

Residential Properties

Rental Transactions
51,918
Average Rental Price
AED 94,885
Average Rent / sq ft
AED 87
Ready Sales

Commercial Properties

Sales Volume
313
Average Price
AED 10,936,000
Average Price / sq ft
AED 1,809
Off-Plan

Commercial Properties

Sales Volume
326
Average Price
AED 4,718,000
Average Price / sq ft
AED 2,855
Rent

Commercial Properties

Rental Transactions
27,538
Average Rental Price
AED 67,830
Average Rent / sq ft
AED 133
Source: supplied Bayut September transaction data; Dubai Land Department registration charts presented by Property Monitor; Property Monitor community sales-price and rental charts. Totals and shares calculated by Worldfield Research.
Residential Sales Trend

Month-on-month residential sales price movements.

Selected charted community sales-price movements for August–September 2026, segmented by asset type. Rankings do not establish coverage of every Dubai community.

Apartment Sales Price — August–September 2026

Selected verified gains
  • Jaddaf Waterfront+3.22%
  • Living Legends+3.00%
  • Al Barsha+2.27%
  • Dubai Water Canal+1.80%
  • Jumeirah Heights+1.11%
Selected verified declines
  • Al Jaddaf-10.95%
  • Dubai Maritime City-7.97%
  • Barsha Heights-6.50%
  • Wasl Gate-5.29%
  • Zabeel-4.54%

Villa / Townhouse Sales Price — August–September 2026

Five largest charted gains
  • Jumeirah Village Triangle+6.27%
  • Palm Jumeirah Fronds – Garden Homes+4.40%
  • Jumeirah Islands+4.30%
  • Jumeirah Village Circle Villas+3.41%
  • Nad Al Sheba+2.17%
Five largest charted declines
  • Motor City-7.47%
  • Al Barari-6.04%
  • The Lakes-5.72%
  • Arabian Ranches-4.48%
  • Meydan-3.25%
Source: Property Monitor community sales-price charts.
Rental Price Trend

Month-on-month rental price movements.

Five largest charted community rental-price gains and declines for August–September 2026. Rankings do not establish coverage of every Dubai community.

Apartment Rental Price — August–September 2026

Five largest charted gains
  • Jumeirah Bay Islands+6.71%
  • Dubai Festival City+2.88%
  • Al Barari+1.49%
  • Majan+1.22%
  • Jumeirah Heights+1.16%
Five largest charted declines
  • Dubai Islands-4.39%
  • Mohammed Bin Rashid City-3.85%
  • Dubai Maritime City-2.87%
  • Zabeel-2.49%
  • Al Kifaf-2.25%

Villa / Townhouse Rental Price — August–September 2026

Five largest charted gains
  • Emirates Hills+3.60%
  • Jumeirah Islands+3.20%
  • Falcon City of Wonders+2.12%
  • Jumeirah Bay Island+1.59%
  • Living Legends+1.37%
Five largest charted declines
  • The Lakes-2.72%
  • Motor City-2.63%
  • The Sustainable City-2.58%
  • Sobha Hartland-2.50%
  • DAMAC Lagoons-2.40%
Source: Property Monitor community rental charts.
Sales Mix

Off-plan made up 68.9% of September residential sales.

Supplied Bayut September transaction data records 7,197 off-plan and 3,255 ready-property residential sales. Off-plan represented 68.9% and ready property 31.1%. The off-plan share was about 3.4 percentage points lower than August's 72.2%, calculated from supplied monthly figures.

Bayut sales mix
10,452
September 2026
  • Off-plan68.9%
  • Ready property31.1%

Source: supplied Bayut September transaction data. Totals and shares calculated by Worldfield Research. Ready-property sales are not presented as verified resales.

What This Means For You

Tailored implications for every market participant.

Investors

Off-plan remained the larger residential sales segment by count. Assess project terms and relevant community comparables; the sales mix does not establish returns.

Discuss with our team

End Users

Ready residential sales were 4.8% higher than the supplied August count, calculated from supplied monthly figures. Compare relevant buildings, unit sizes and transaction prices.

Discuss with our team

Landlords

Community rent movements varied. Benchmark similar units in the relevant area rather than treating the highest charted community rent as a typical Dubai rent.

Discuss with our team

Developers & Occupiers

Separate residential off-plan activity from commercial sales and commercial rentals. Commercial sales were higher than the supplied August counts; the files do not explain why.

Discuss with our team

Source: supplied Bayut September transaction data; Dubai Land Department registration charts presented by Property Monitor; Property Monitor community sales-price and rental charts. Totals and shares calculated by Worldfield Research.

Lead Generation

Need expert Dubai real estate advice?

Our advisory team works with investors, end-users, landlords and developers across Dubai's residential and commercial markets. Request a confidential consultation.

Location

Worldfield Real Estate LLC
Onyx Tower 1, Office 814, Dubai,
P.O. Box 566069, U.A.E.

Contact

  • +971 (0)50 347 2079
  • +971 (0)4 398 0822
  • contact@worldfield.com

Properties

  • Residential Investments
  • Secondary Properties
  • Leasing

Quicklinks

  • Blogs
  • Terms & Conditions
  • Privacy Policy
  • Customer Complaints and Dispute Resolution Policy
© 2026 Worldfield Real Estate. All rights reserved.Source: Dubai Land Department, Bayut, Property Monitor, Worldfield Research.
Dubai commercial real estate skyline
Worldfield Research

Dubai market intelligence, reserved for informed decisions.

Access detailed transaction performance, pricing movement and community-level trends from Worldfield Research.

Complimentary Access

Unlock the full market report.

Enter your details to view Worldfield's latest Dubai real estate market analysis.

SEP2026

Your information will only be used for relevant property and market-related communication.